Wifi-signal-to-noise, the MacOS Performance tool and monitoring RSSI on the commandline
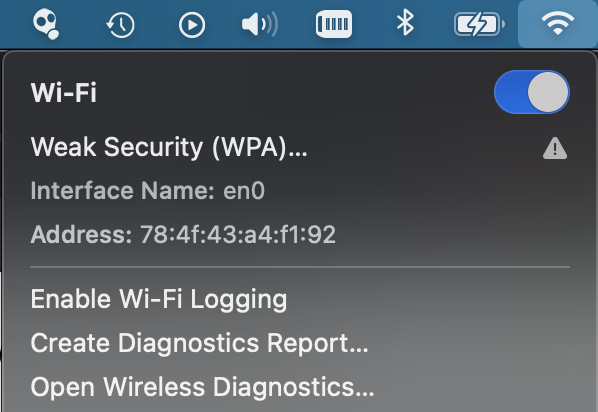
MacOS has a nifty wifi signal strength diagnostics tool hidden under the wifi icon in the menu. Option-click the icon and choose Open Wireless Diagnostics:

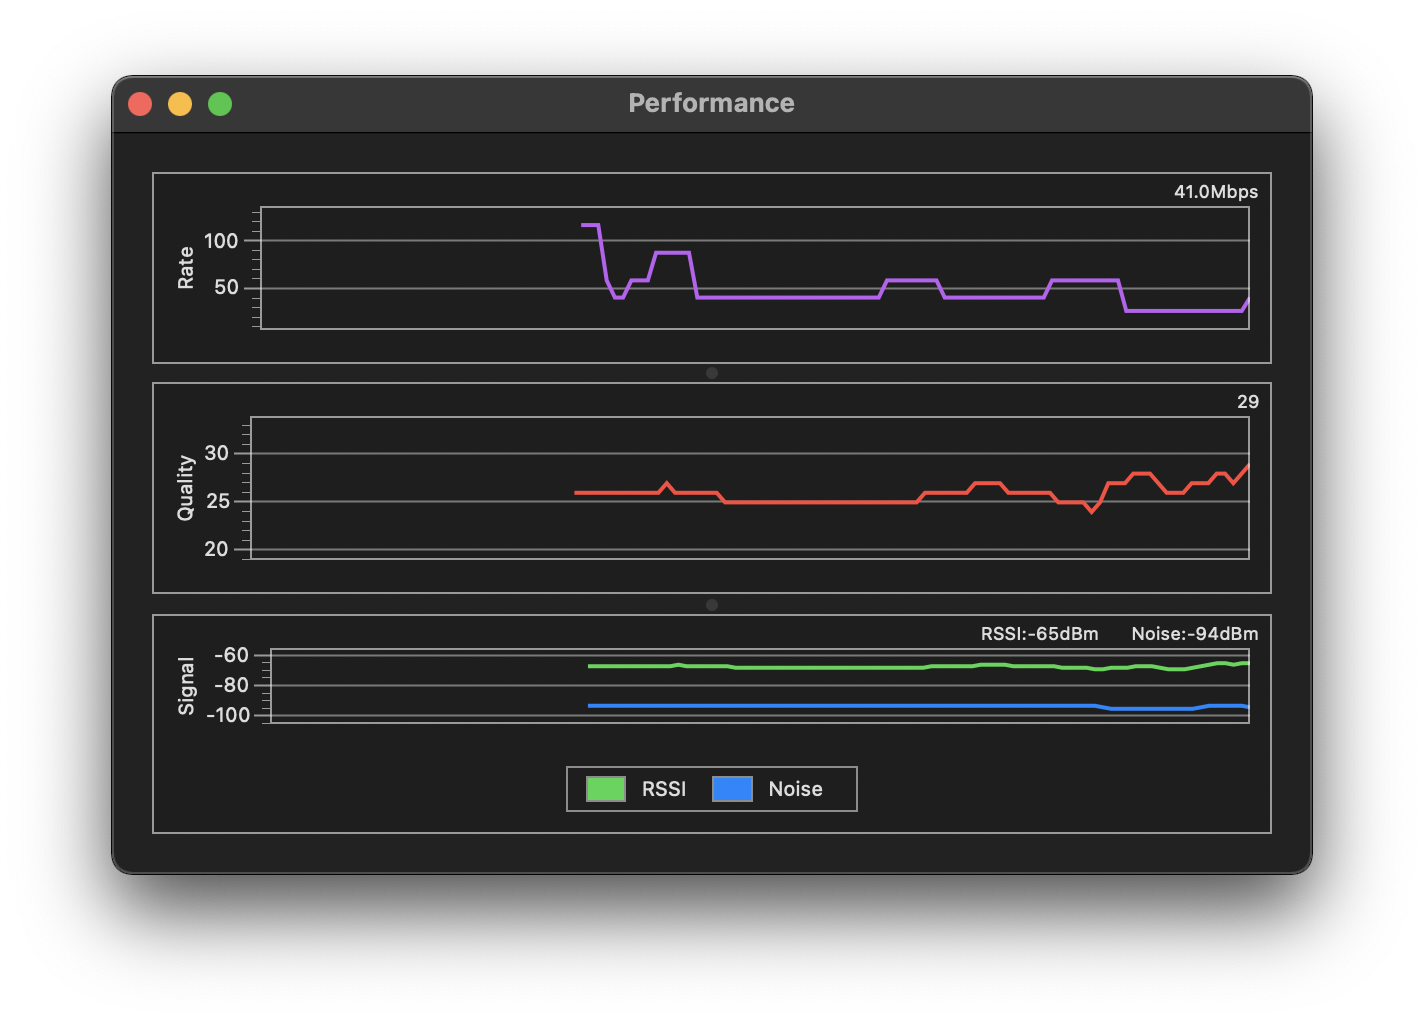
Ignore the Wireless Diagnostics window that opens, and from the Wireless Diagnostics Window menu, click Performance. You’ll be able to see your wifi Rate, Quality and Signal.
Your signal to noise ratio should be above 20, which is presumably why the MacOS wifi diagnostics tool has 20 as the first label on its y Quality axis:

Here, I’ve got an RSSI of -65dBm and a Noise value of -94dBm, which means the signal-to-noise value, aka Quality is -65 - -94 = 29.
There ought to be a direct way to open the Performance tool from terminal, perhaps passing an option to:
/System/Library/CoreServices/Applications/Wireless\ Diagnostics.app/Contents/MacOS/Wireless\ Diagnostics
but I haven’t discovered it yet. If you do the above, you still need to open the Performance tool from the Wireless Diagnostics Window menu.
You can also poll the wifi data from the commandline with:
/System/Library/PrivateFrameworks/Apple80211.framework/Versions/Current/Resources/airport -I | egrep -E 'agrCtlRSSI|agrCtlNoise|lastTxRate'
which will show you your signal, noise and rate (in Mbps).
agrCtlRSSI: -70
agrCtlNoise: -88
lastTxRate: 88
If you want to poll it regulary combine this with watch:
watch -n1 "/System/Library/PrivateFrameworks/Apple80211.framework/Versions/Current/Resources/airport -I | egrep -E 'agrCtlRSSI|agrCtlNoise|lastTxRate'"
which runs the command every second (-n 1), and you can find those wifi dead zones.
Recent posts:
- Patch for aarch64 (aka arm64) openssl 1.0.2 'relocation R_AARCH64_PREL64 against symbol OPENSSL_armcap_P error'
- TIL: the `NO_COLOR` informal standard to suppress ANSI colour escape codes
- Copy the contents of a branch into an existing git branch without merging
- Adding search to a static Jekyll site using pagefind
- asdf, python and automatically enabling virtual envs